Food Price Monitoring Fundamentals: What You Need to Track
Start tracking food prices the right way. We show you which staples matter most, how to organize your data, and what patterns actually predict budget impact.
Read articleFAMA reports aren’t intimidating once you know where to look. We’ll walk you through wholesale prices, retail variations, and what those numbers actually mean for your shopping decisions.
The Federal Agricultural Marketing Authority — FAMA — publishes market data three times a week. Most people don’t realize they can access these reports. Even fewer actually use them. That’s a shame, because understanding what FAMA reports tell you gives you real insight into why your groceries cost what they do.
Here’s the thing: food prices don’t move randomly. They respond to supply, demand, and seasonal patterns that FAMA tracks meticulously. When you know how to read the data, you’re not guessing anymore — you’re informed.

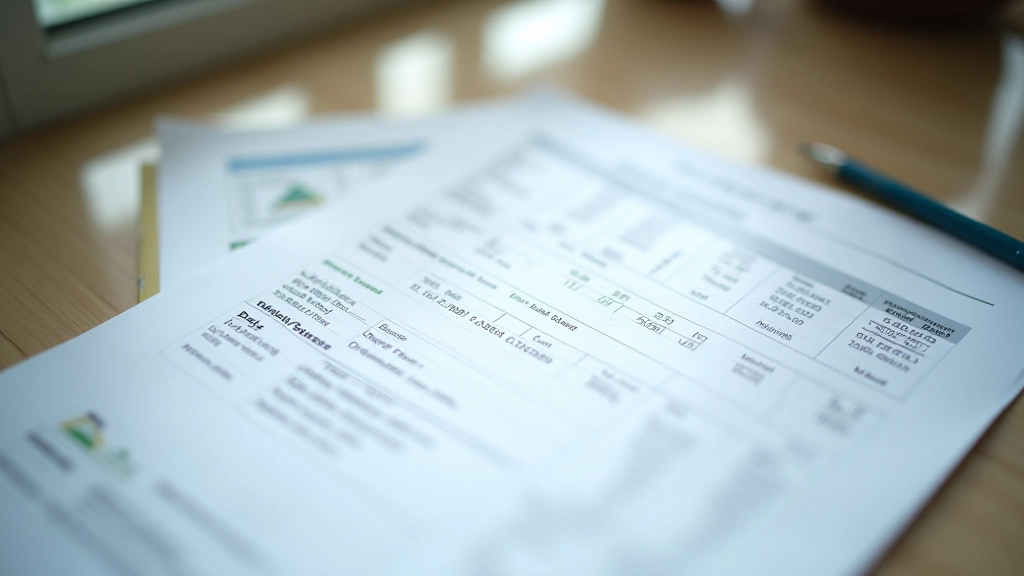
FAMA publishes three main price categories: wholesale prices, retail prices, and producer prices. Each tells a different story. Wholesale is what sellers pay when buying direct from farmers or suppliers — this is your baseline. Retail is what you actually see at the supermarket checkout. The gap between them? That’s where transportation, handling, storage, and profit sit.
The reports are organized by commodity — rice, chicken, eggs, vegetables, fruits. Each gets its own line item with current price, previous week’s price, and the percentage change. You’ll also see seasonal notes and market observations from FAMA’s field teams. These aren’t random comments — they’re tracking actual conditions in major markets across Malaysia.
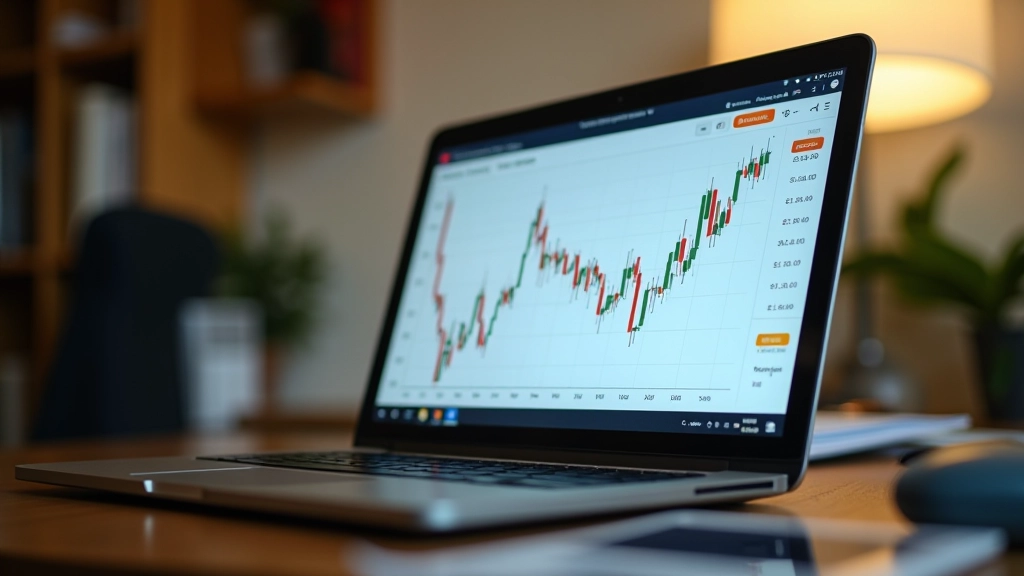
Don’t get lost in the numbers. Focus on three things first: the main commodity you’re interested in, the wholesale-to-retail spread, and the week-over-week trend direction.
Breaking down what each data point tells you
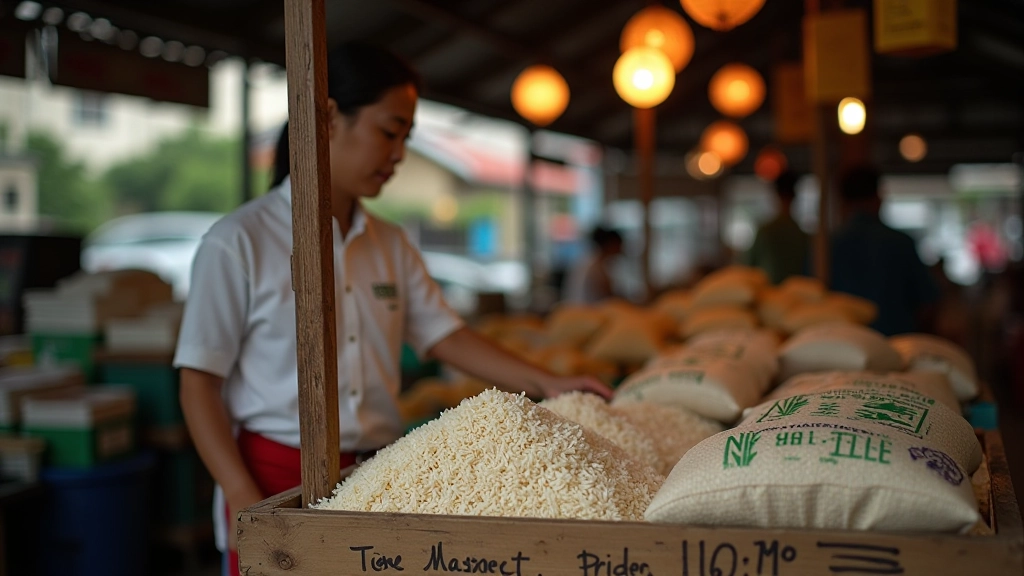
Find the food you’re tracking in the list. Rice has multiple varieties — long grain, short grain, fragrant — so check the specific type. Same with vegetables. The price for cabbage is different from the price for tomatoes, obviously. FAMA lists these separately because they move independently.
This is what businesses pay. It’s your baseline. If wholesale chicken was RM8 per kg last week and is now RM8.50, that’s a 6% jump. That matters because retail prices usually follow wholesale within a few days. When wholesale spikes, retail follows soon after.
Now look at what retailers are charging. If wholesale is RM8.50 and retail is RM12, that’s a 41% markup. That seems high, but it covers cold storage, handling labor, transportation, and the store’s operating costs. A 30-40% markup is typical for perishables. If it’s higher, that suggests limited competition or storage pressures.
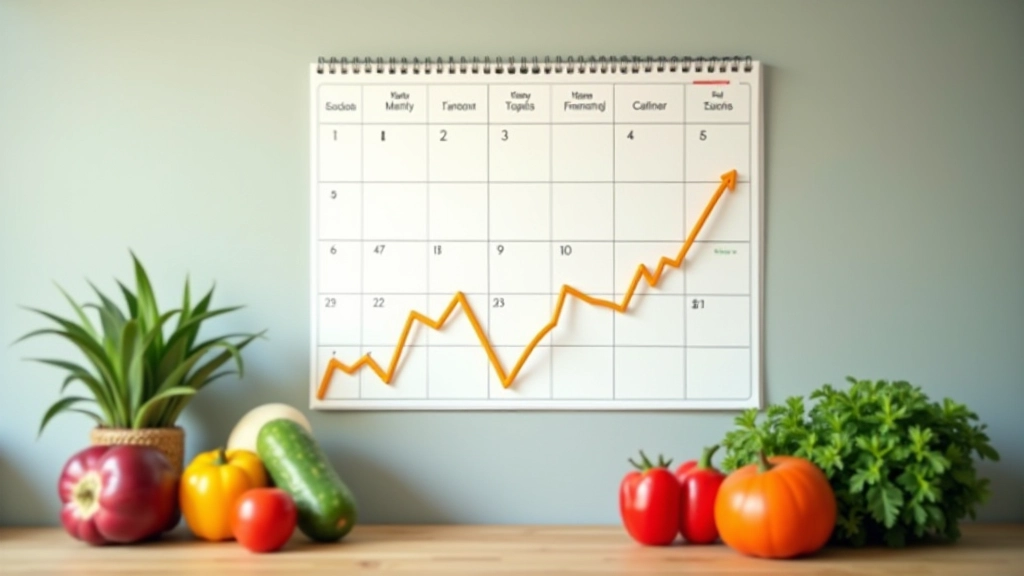
FAMA shows whether prices went up, down, or stayed stable compared to the previous report. Up arrows () mean prices are rising. Down arrows () mean they’re falling. A stable line () means no change. Trends matter more than single numbers. Three weeks of steady increases tells you something different than one-week spike.
FAMA includes brief market notes alongside the prices. These aren’t fluff — they’re actual market observations from field teams. You’ll see notes like “supply tight due to weather disruption” or “increased availability pushing prices down.” These explain the numbers.
Let’s say rice prices jumped 8% in one week. The note says “low rainfall reducing planted area.” That tells you it’s a supply-side shock, not demand-driven. This matters because supply shocks can be temporary (new rains will help next month) or persistent (drought lasting months). The note helps you judge whether to expect prices to fall soon or stay elevated.
Chicken prices drop 5% with a note saying “festival season over, demand normalizing.” That’s your signal prices will probably stay down for a few weeks. Without reading the notes, you’d just see numbers. With them, you understand the why.

Real-world applications for smart shopping and planning
If FAMA shows prices trending down for vegetables, that’s your signal to stock up on non-perishables. If you see three consecutive weeks of increases, buy fresh items sooner rather than later. This isn’t speculation — it’s reading published data about actual supply conditions.
FAMA data shows clear seasonal patterns. Rice prices typically fall during harvest (August-October). Leafy vegetables are cheaper during monsoon seasons. Chicken prices spike during festivals. Once you see these patterns in the data, you can plan purchases around them instead of being surprised by sudden price jumps.
When one item spikes while everything else stays stable, FAMA’s notes explain why. A 15% jump in fish prices with a note about “weather limiting catches” is temporary. Same jump with no explanation might signal structural problems. You’ll learn to distinguish between normal fluctuation and genuine shortages.
By monitoring the staples your family actually eats, you can anticipate budget pressure. If rice, eggs, and chicken prices all trend up in the same month, your grocery bill will definitely rise. You can adjust other spending to compensate instead of getting surprised at checkout.
First mistake: comparing wholesale to retail directly. You can’t. They’re different markets with different markups. Don’t expect retail to match wholesale price — it never will. A 30-40% markup is completely normal.
Second mistake: overreacting to one week’s data. Markets fluctuate weekly. One week of increases doesn’t mean prices will keep climbing forever. Look at three to four weeks of data to spot real trends. FAMA publishes reports three times weekly specifically so you can build a picture over time.
Third mistake: ignoring the market notes. The numbers mean nothing without context. A 5% jump is concerning if supply is shrinking. It’s meaningless if demand just surged during a festival. Always read the explanation alongside the numbers.

FAMA publishes reports on their official website and through major Malaysian news outlets. The reports are free and publicly available — there’s no paywall or subscription needed. You’ll find weekly summaries, commodity-specific data, and detailed price tables. Reports come out Mondays, Wednesdays, and Fridays. Some retailers and food bloggers republish summaries on their platforms too, but going directly to FAMA gives you the complete picture.
Start simple: pick three foods your family buys regularly. Track them for four weeks using FAMA data. You’ll start seeing patterns naturally. The numbers that seemed intimidating will become familiar. You’ll develop instinct for what’s normal and what signals real change.
This guide explains how to interpret publicly available FAMA market data for informational purposes. Market prices depend on numerous factors including supply, demand, weather, policy, and global conditions. Understanding FAMA reports helps you stay informed about food price trends, but prices can change rapidly due to unforeseen circumstances. This information is educational — not a substitute for professional market analysis or financial advice. Always consult current market reports directly from FAMA for the most up-to-date pricing information.