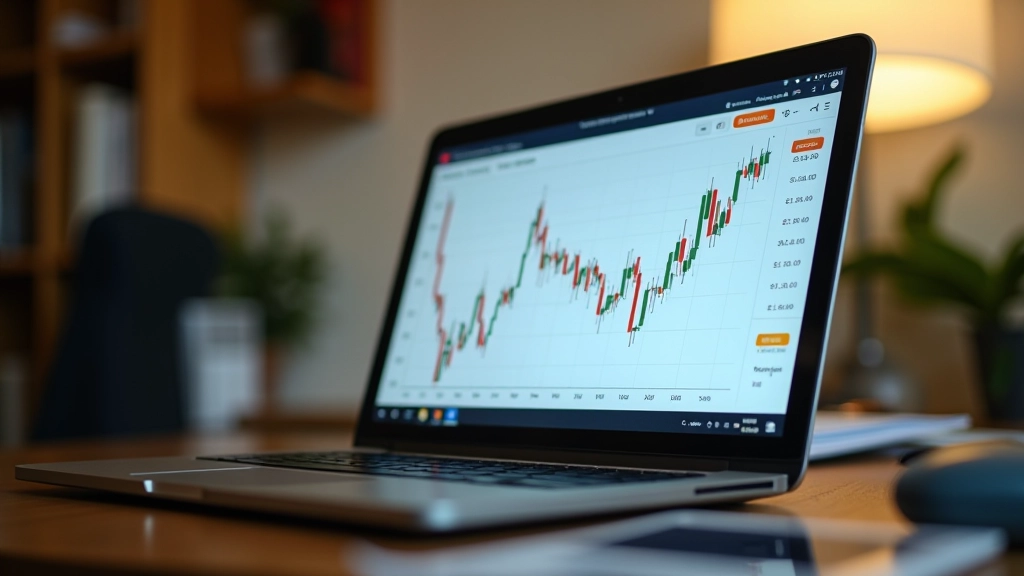
How to Read FAMA Market Data: A Practical Guide
FAMA reports aren’t intimidating once you know where to look. This guide explains what each column means and how to spot price trends in official data.
Read ArticleStart tracking food prices the right way. We show you which staples matter most, what data to collect, and simple systems that work without spreadsheets.

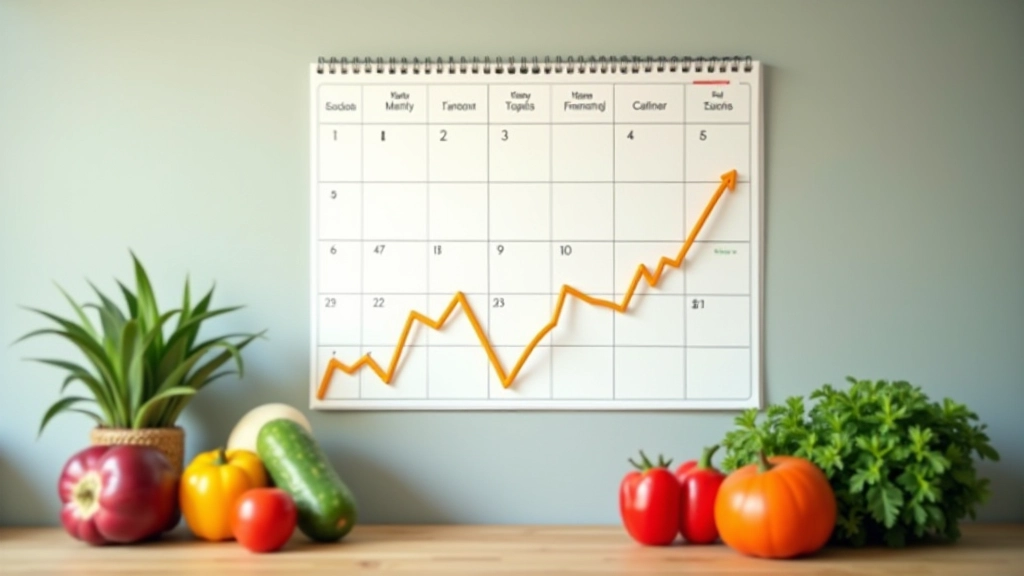
Food prices shift constantly. One month rice costs RM2.50 per kilogram, the next it’s RM2.80. Vegetables spike during monsoon season. Oil prices jump without warning. If you’re buying groceries regularly or managing a household budget, these changes matter. They’re not random. They follow patterns — seasonal trends, supply chain disruptions, government policies, and global market forces all play a role.
The good news? You don’t need expensive software or complicated systems. You don’t need to be an economist. What you need is a simple approach that captures the right information at the right time. When you track prices consistently, you’ll spot patterns. You’ll know when to buy in bulk. You’ll understand what’s driving costs up or down. That knowledge saves money and reduces stress about grocery shopping.

You can’t track everything. Focus on these essential items first — they drive your budget most.
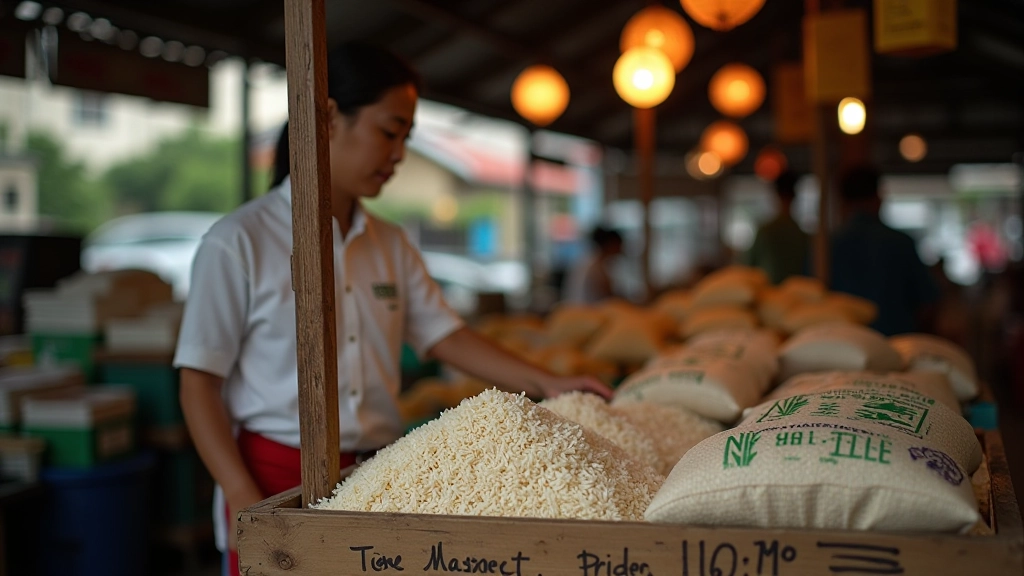
The foundation of most Malaysian meals. Prices typically shift seasonally — harvest season (August-November) usually brings lower prices. Track both regular white rice and premium varieties if your household buys them.
Moves dramatically based on global palm oil markets. A RM3 bottle one month might cost RM3.50 the next. Track the price per liter to compare fairly across different bottle sizes.
Your primary protein sources. These fluctuate with feed costs and supply availability. Track prices per kilogram for chicken and per dozen for eggs to maintain consistency across months.
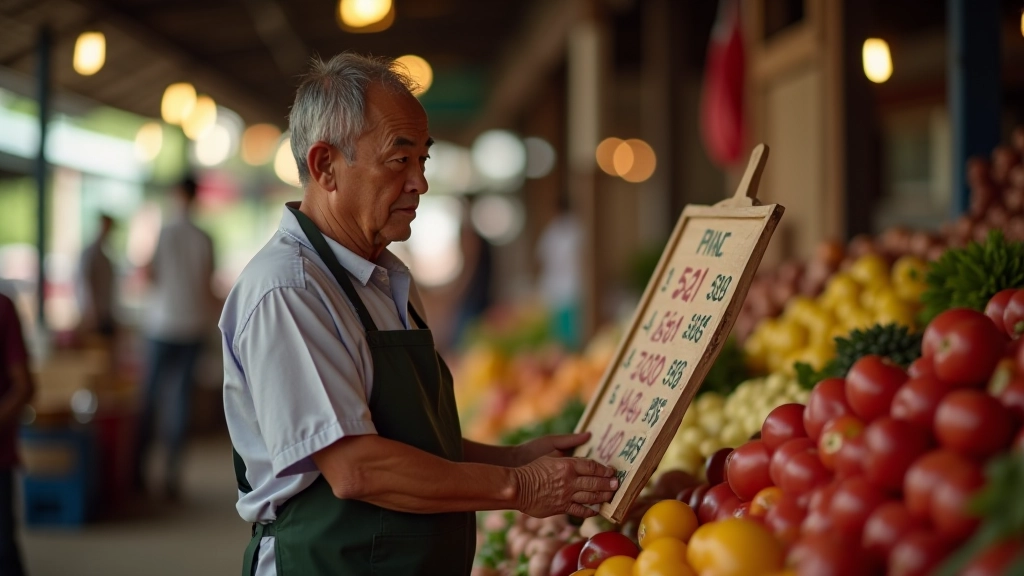
Pick the ones your family eats regularly — maybe cabbage, tomatoes, and onions. Don’t track every vegetable. These vary wildly by season, so tracking helps you plan meals around what’s affordable.
These are government-controlled items with regulated prices. Still worth monitoring because price caps change and your local market might occasionally charge more.
Milk, cheese, yogurt — prices shift based on imports and local production. If your household uses these regularly, include at least milk in your tracking.
You don’t need complicated spreadsheets. Here’s what matters:


You’ve got options. Pick what fits your life.
After 4-6 weeks of tracking, patterns emerge. Here’s what to look for.
Rice prices drop during harvest (August-November), then rise. Vegetable prices jump during monsoon season when supply tightens. If you notice vegetables cost 40% more in November than October, that’s a pattern worth planning around. Next year, buy and preserve vegetables in October.
Pasar Besar might sell eggs RM9 per dozen while the supermarket charges RM10.50. Once you know this, you can make smart shopping choices. Some items are consistently cheaper at markets. Others cost less at supermarkets. Your data reveals this.
Is cooking oil trending up slowly? Has chicken stayed stable for three months? These trends help you predict next month’s costs and plan your budget accordingly. If you see a 5% monthly increase in rice, that’s information worth having.
Sometimes prices rise because quality improves. Sometimes it’s just inflation. Your notes on quality help you understand which is happening. If eggs cost more but they’re genuinely fresher, that’s different than just market markup.
Malaysia has price control mechanisms for certain staples. Understanding these helps you interpret your price data.
You don’t need permission or perfect conditions. Pick your tracking method — paper notebook, Google Sheets, or notes app. List your 5-6 staple items. Record prices for the next four weeks. After month one, you’ll have your baseline. After month two, you’ll spot patterns. That’s all you need to make smarter grocery decisions.
Read: How to Interpret FAMA Market DataThis article provides educational information about food price tracking methods and patterns in Malaysia. Price data varies by location, vendor, season, and product quality. Information here is based on general market observations and government policy frameworks. This isn’t financial advice or price predictions. For official market prices, consult FAMA’s published daily reports. For budget planning decisions, consider your personal circumstances. Market conditions change regularly — track your own data for the most accurate picture of prices in your area.